How Much GPU Memory to Serve an LLM
Pick a GPU for an LLM and it 'fits' on paper, then OOMs under load. A quick way to estimate the VRAM a model needs: weights, KV cache, and overhead.

The math everyone does first is the one that gets them in trouble. An 8-billion-parameter model in fp16 is sixteen gigabytes of weights. You have a 24 GB card, so it fits with room to spare. You deploy it, a couple of people use it, and everything is fine. Then real traffic arrives, a few requests with long prompts land at once, and the server throws CUDA out of memory on a card that supposedly had 8 GB clear.
The weights were never the problem; they are the one cost that doesn’t move. What fills the rest of the card is the KV cache, the stored attention state for every token in flight, and it scales with every token and every concurrent request. So the question that matters is not “does the model fit?” but “does the model plus its working memory fit under the load I actually expect?”
This post gives you a way to estimate that before you provision anything. It is for engineers who are about to pick a GPU or size a serving deployment, and who want a number they can defend rather than a guess.
I kept coming back to this on Archi, the RAG copilot I worked on for CMS computing operations at CERN, where a single answer can drag thousands of tokens of logs and documentation into the context. It also comes up on the shared GPU nodes where several services want the same card at once. Getting the estimate roughly right is the difference between a deployment that holds and one that pages someone.
The three things using your VRAM
Every serving setup spends GPU memory (VRAM) on the same three things. Keep them separate in your head, because they behave completely differently.
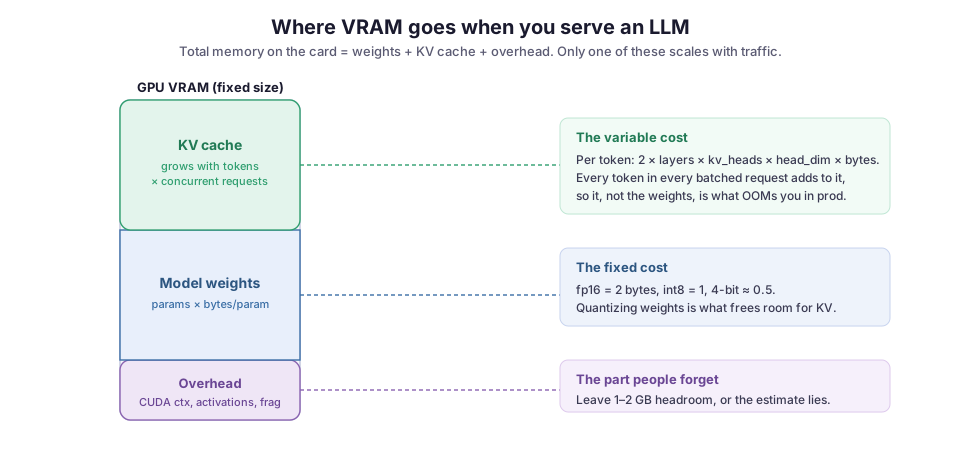
- Model weights are fixed. You pay for them once at load, and the number never changes no matter how much traffic you take.
- The KV cache is the variable cost. It grows with the length of each request and the number of requests you run at once.
- Overhead is everything else the runtime needs to exist: the CUDA context, the activation tensors that flash into life during a forward pass, and memory the allocator holds but can’t hand out because it is fragmented.
Estimate all three, or the estimate is worthless.
Model weights: the cost that doesn’t move
Weights are the easy part. Multiply the parameter count by the bytes each parameter takes:
weight_memory = num_parameters × bytes_per_parameterThe bytes per parameter come straight from the precision you serve at:
- fp32 (full precision) is four bytes, and almost nobody serves at it.
- fp16 or bf16 is two bytes, the common default.
- int8 quantization drops it to one byte.
- 4-bit formats like GPTQ, AWQ, or NF4 land around half a byte once you count the small overhead of scales and zero-points (the extra numbers stored to map compressed values back to real ones).
| Precision | Bytes/param | 8B model | 70B model |
|---|---|---|---|
| fp32 | 4 | 32 GB | 280 GB |
| fp16/bf16 | 2 | 16 GB | 140 GB |
| int8 | 1 | 8 GB | 70 GB |
| 4-bit | ~0.5 | ~4 GB | ~35 GB |
This table alone explains most GPU-selection decisions. A 70B model in fp16 does not fit on a single 80 GB H100 once you leave room for anything else, so people either shard it across cards or quantize it. It is also why quantization is usually the first lever anyone pulls. Halving the bytes per parameter halves the fixed cost, and as the next section shows, the memory you free doesn’t just sit there.
KV cache: the cost that scales with traffic
A transformer generates one token at a time. To produce each new token, attention compares it against the keys and values of every token before it. Recomputing those every step would be pure waste, so the model computes them once and keeps them. That store is the KV cache, and the model’s architecture fixes its size per token (Vaswani et al., “Attention Is All You Need”):
bytes_per_token = 2 × num_layers × num_kv_heads × head_dim × bytes_per_elementThe leading 2 is there because you store both keys and values. Take Llama-3.1-8B. Its config has 32 layers and a head dimension of 128. Thanks to grouped-query attention, where several query heads share one key/value head, it has only 8 key/value heads rather than 32. In fp16:
2 × 32 × 8 × 128 × 2 = 131,072 bytes ≈ 128 KB per tokenThat looks tiny until you multiply it out. An 8k-token request is about 1 GB of KV cache. Run thirty-two of those at once and you’re asking for 32 GB of cache alone, more than the whole card.
This is the line most capacity plans miss. The cache cost is roughly bytes_per_token × total_tokens_in_flight, and total tokens in flight is context length times concurrency. It is a multiplication, not an addition. That is why a setup that is comfortable in testing falls over the moment real concurrency shows up.
Grouped-query attention deserves a callout, because it is doing quiet work here. Without it, an 8B model with 32 KV heads would burn four times the cache per token. If you’re comparing two models of the same size, check num_key_value_heads before you assume their memory profiles match.
Overhead: the part people forget
The last slice is the hardest to pin down and the easiest to ignore. It has three parts:
- Runtime startup. Loading CUDA and the framework costs a few hundred megabytes to a gigabyte before you touch a model.
- Activations. During the forward pass, activation tensors briefly claim memory that scales with batch size and sequence length. This is worst in the prefill phase, where the whole prompt is processed at once.
- Fragmentation. The allocator holds memory in a way that can fragment, so the card reports free space it can’t actually hand to a large contiguous allocation.
You don’t estimate this precisely; you reserve for it. A gigabyte or two of headroom on a single card is a reasonable floor, more if you run long prefills or big batches. Serving frameworks make this explicit. vLLM’s gpu_memory_utilization defaults to 0.9, meaning it deliberately leaves ten percent of the card untouched. That knob isn’t caution for its own sake; it is the overhead slice, named.
Putting it together: a worked example
The whole estimate is one formula:
total_VRAM = weight_memory
           + (bytes_per_token × max_context × max_concurrent_requests)
           + overhead
Here it is applied to Llama-3.1-8B on a 24 GB card, the size of an L4 or a consumer 4090:
- In fp16, the weights are 16 GB.
- Reserve 1.5 GB for overhead.
- That leaves 6.5 GB for KV cache, which at 128 KB per token is roughly 52,000 tokens of budget.
That is about six concurrent requests at 8k context, or a single 48k-token conversation, and not much else.
Now quantize the weights to int8. They drop to 8 GB, and suddenly there is 14.5 GB for KV cache instead of 6.5. Same card, same model, but the number of concurrent requests you can serve roughly doubles.
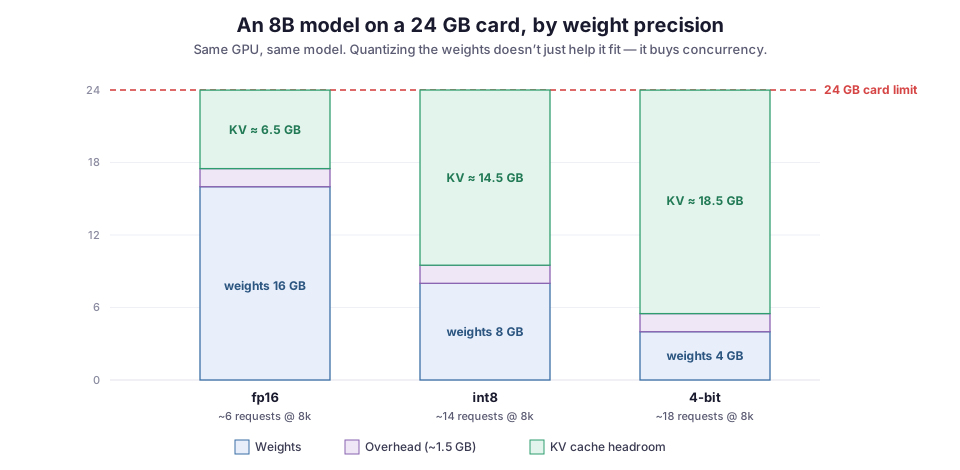
That is the real payoff of quantizing weights, and it’s easy to miss when you only ask whether the model fits. The freed memory becomes throughput. Every gigabyte you claw back from the weights is a gigabyte the KV cache can use to hold more simultaneous conversations.
Where the estimate breaks
The formula gets you a defensible starting number. Here is how it still surprises people in production.
Concurrency, not context, is usually what kills you. The KV term multiplies context length by the number of requests in flight. Teams size for a comfortable context window and test one request at a time, then discover the cache term explodes the moment several long requests overlap. If you serve with continuous batching (which you should), peak simultaneous requests set the ceiling, not the average.
Prefill spikes are real and transient. Processing a long prompt all at once creates a burst of activation memory that a decode-only estimate never sees. If your service accepts occasional very long prompts, the out-of-memory error will happen during their prefill, not their generation. It will also be intermittent enough to be maddening to reproduce.
Fragmentation eats the margin you thought you had. Naive KV allocation reserves the full context length up front, even for short requests, and wastes most of it. PagedAttention solves exactly this problem by paging the cache like virtual memory, so you pack far more requests into the same space. If you’re not using a paged runtime, discount your usable KV budget hard.
Multi-GPU isn’t free. Sharding a model across cards with tensor parallelism adds communication buffers and doesn’t divide memory perfectly by the number of GPUs. Two 24 GB cards don’t give you a clean 48 GB for one model, so budget for the overhead of splitting it.
What I would actually do
Estimate first, then measure, and never trust the estimate alone. My process:
- Use the formula to pick a card and a rough concurrency target.
- Load the model and watch real memory with
nvidia-smiunder a load test that mimics the traffic shape I expect: the long prompts, the bursty concurrency, the worst case rather than the average. - Set the runtime’s limits explicitly: a
max_model_lenthat matches the context I actually support, and agpu_memory_utilizationthat leaves honest headroom.
A server that refuses a request cleanly when it is full is far better than one that accepts everything and dies halfway through generating an answer.
That last point is the same instinct behind sizing Kubernetes memory limits so a pod fails predictably instead of taking a node down with it. On the shared GPU nodes behind CMS workflow operations, a model that quietly right-sizes itself and stays inside its budget is worth more than one that is theoretically faster and occasionally falls over. The estimate isn’t about squeezing the last megabyte out of a card. It’s about knowing, before you deploy, roughly how much traffic the thing can hold, so the answer to “will this fit?” is a number rather than a hope.
Diagrams by M. Hassan Ahmed, released under CC0. No external image was used for this post; the figures are original work by the author.