Kubernetes OOMKilled: Requests vs Limits
Your pod died with OOMKilled and exit 137. What Kubernetes memory requests and limits actually do, what triggers the kill, and how to stop it happening.

A service that ran fine all week starts dying. kubectl get pods shows it restarting, and kubectl describe has one part that matters:
    State:          Running
    Last State:     Terminated
      Reason:       OOMKilled
      Exit Code:    137
Nothing in the code changed, and the image is the same one that shipped on Monday. What changed is how much memory the container needed. It crossed a line you set weeks ago and forgot about.
This post is for engineers who run services on Kubernetes and have hit OOMKilled without a clear picture of what is going on. It covers what memory requests and limits actually do, why the two kills that mention memory are different events, and which settings actually stop the kills. I ran the Kubernetes side of the CMS workflow operations stack at CERN. There, a WMCore service quietly growing past its memory limit is the difference between a slow afternoon and a paged night.
Exit code 137 means “killed by a signal”
Start by reading the exit code correctly. 137 is 128 + 9. The 128 + is the shell convention for “terminated by a signal”, and 9 is SIGKILL.
So the container did not throw an exception, did not log a stack trace, and did not get a chance to clean up. Something outside the process sent it a SIGKILL, which a process cannot catch or handle, and the process stopped mid-instruction. Pair that with Reason: OOMKilled and you know who pulled the trigger: the Linux kernel’s out-of-memory (OOM) killer. It acted because the container’s cgroup (the kernel mechanism that caps a group of processes’ resources) hit its memory ceiling.
That detail rules things out. A SIGKILL from the OOM killer means no graceful shutdown ran, so any “on exit, flush the buffer” logic did not fire. If you are debugging lost writes alongside an OOMKill, that is why. The process did not get to say goodbye.
Why memory kills and CPU only slows down
CPU and memory look like the same kind of resource in a pod spec. Under pressure they behave nothing alike.
CPU is compressible. When a container wants more CPU than its limit, the kernel throttles it. The container runs slower, and everyone survives.
Memory is incompressible. You cannot run a process on “less memory than it is asking for right now.” Once a container’s allocations reach its memory limit, there is nothing to throttle. The kernel’s only lever is to kill something in the cgroup and reclaim the pages.
So the mental model is simple: a CPU limit slows you down; a memory limit kills you. Every OOMKill follows from that asymmetry.
Requests and limits are read by different components
The pod spec asks for two memory numbers per container. Two different parts of Kubernetes read them, at two different times. The comments in this snippet say which part reads which:
resources:
  requests:
    memory: "512Mi"   # what the SCHEDULER reserves
  limits:
    memory: "1Gi"     # what the KERNEL enforces
The request is a scheduling input. The kube-scheduler places your pod on a node only if the node’s existing memory requests plus yours still fit in the node’s allocatable memory. The request is a reservation. Once the pod is scheduled, the request has mostly done its job, and the running container is not held to it.
The limit is a runtime input. It becomes the memory ceiling on the container’s cgroup, and the kernel enforces it directly. Cross it and the OOM killer runs.
The scheduler never looks at limits when it places a pod. That causes the most dangerous surprise: limits can add up to more than the node has. The scheduler packed the node by requests and cheerfully let the limits overcommit it.
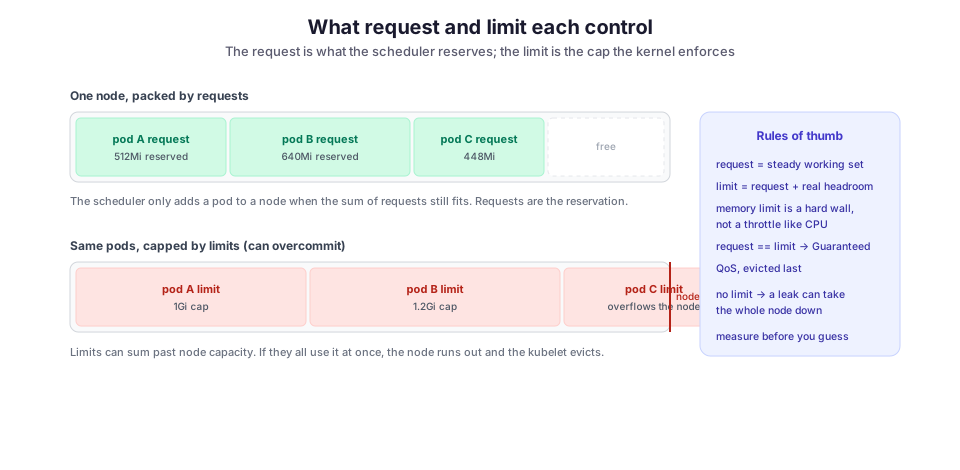
Keep the gap between those two bars in mind, because both failure modes live there:
- Set one container’s limit too low, and that container OOMKills itself.
- Let the limits overcommit the node too far, and the whole node runs out of memory.
Two different kills that both say “memory”
When people say “the pod got OOMKilled,” they usually mean one specific thing. But Kubernetes has two distinct memory kills, and if you confuse them you end up debugging the wrong layer.
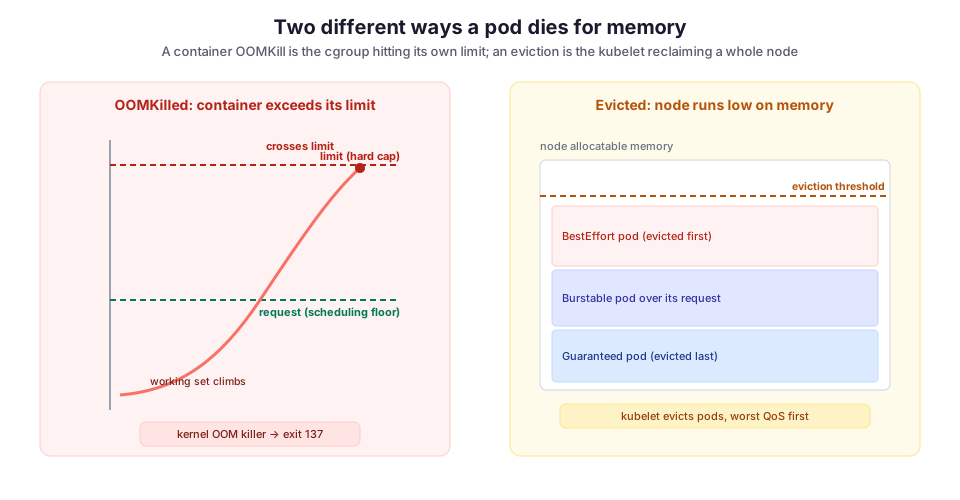
Container-limit OOMKill. One container reaches its own limit. The cgroup OOM killer terminates the process in that container, the kubelet reports Reason: OOMKilled, and the pod restarts according to its restartPolicy. This kill is local. The node might have gigabytes free; this one container simply asked for more than its own cap allowed. This is the kill you see in kubectl describe pod.
Node-pressure eviction. The node runs low on memory, whatever any single container’s limit is. The kubelet (the agent on each node that runs pods) monitors node memory. When free memory drops below its eviction threshold, it proactively evicts whole pods to reclaim memory. This shows up as Reason: Evicted, not OOMKilled, often with a message like The node was low on resource: memory. The evicted pod may have been well within its own limit. It was chosen because the node as a whole was in trouble.
To tell which one you hit, check the reason field and where it appears:
OOMKilledon the container indescribe podmeans a limit problem for that container.Evictedon the pod, plusMemoryPressureon the node inkubectl describe node, means a node-packing problem.
The two have different fixes, so read the field before you change anything.
QoS class decides who gets evicted first
When the kubelet evicts pods under node pressure, it does not choose at random. It ranks pods by their Quality of Service class (QoS class). Kubernetes assigns the class based on how you set requests and limits:
- Guaranteed: every container sets a memory (and CPU) limit equal to its request. Evicted last. Use this class for anything that must not be sacrificed to save the node.
- Burstable: at least one container has a request or limit set, but the pod does not match the Guaranteed pattern. This is the common case. Under pressure, a Burstable pod using more than its request is a prime eviction target.
- BestEffort: no requests or limits at all. Evicted first, always. Fine for a throwaway batch job, wrong for anything that holds state.
In practice, this means the request is not only a scheduling number; it also sets your place in the eviction order. A pod running under its request is a poor eviction candidate. A pod running well over its request is the first Burstable pod to go. A request that reflects real steady-state usage keeps a healthy pod from becoming collateral damage when a noisy neighbor fills the node.
Diagnosing an OOMKill without guessing
Start with the pod, then widen out. The exit reason tells you which of the two kills you are dealing with. These three commands show the last exit reason per container, the full pod status and events, and whether the node itself is under memory pressure:
# Which containers were OOMKilled, and their last exit reason
kubectl get pod <pod> -o jsonpath='{range .status.containerStatuses[*]}{.name}{": "}{.lastState.terminated.reason}{" ("}{.lastState.terminated.exitCode}{")"}{"\n"}{end}'

# Full picture: events, restart count, the Terminated block
kubectl describe pod <pod>

# Is the NODE under memory pressure? (eviction vs container OOM)
kubectl describe node <node> | grep -A5 Conditions
If it is a container OOMKill, the next question is how close the container runs to its limit in normal operation. Compare the limit against actual usage, not against the request. If you have metrics-server or Prometheus, the working set is the number to watch:
kubectl top pod <pod> --containersThat command gives you a single reading. Look at container_memory_working_set_bytes over time instead. The working set is roughly the memory the kernel cannot reclaim under pressure, and that is what the OOM decision is made against.
For example, a container that idles at 300Mi and spikes to 1.1Gi on a large request needs a limit above that spike. A single snapshot from kubectl top will not show you the spike. Graph it.
Setting the numbers so the kills stop
There is no universal right value, but there is a reliable procedure.
- Measure the working set under real load, including the peaks. Run the service through a representative workload and watch
container_memory_working_set_bytes. You want the p99 of that curve, not the average, because the OOM killer does not care about your average. - Set the request at the steady working set. This is what the scheduler reserves, and it anchors your QoS ranking. Too low, and the node gets overcommitted and your pod becomes an eviction target. Too high, and you waste reserved memory the pod never uses and fit fewer pods per node.
- Set the limit at the peak plus honest headroom. The limit must sit above the worst legitimate spike you measured, with margin for allocations you did not think to test. A limit equal to the average guarantees an OOMKill the first time real traffic arrives.
- For anything stateful or latency-critical, make the request equal the limit. That gets the pod the Guaranteed QoS class, so the kubelet evicts it last. It also removes the overcommit gap for that pod entirely. You pay in reserved memory that sits idle, and for a service that must not die, that is the right trade.
This is what step 4 looks like in the spec:
resources:
  requests:
    memory: "1Gi"
  limits:
    memory: "1Gi"   # request == limit  ->  Guaranteed QoS
Failure modes that send people in circles
The runtime does not see the cgroup limit. This is the classic one. A JVM from before container awareness sizes its heap from the host’s total memory, not the container limit. It happily grows a heap far past the cgroup cap, then gets OOMKilled while it still thinks it has plenty of “free” heap. Runtimes handle this differently:
- Modern JVMs honor the limit via
UseContainerSupport(on by default) plus-XX:MaxRAMPercentage. - Go added
GOMEMLIMITfor the same reason. - A plain Python or Node process has no such knob and will run right up to the cgroup wall and die.
If your OOMKilled container hosts a VM-based runtime, check that the runtime knows about the limit before you touch the limit itself.
CrashLoopBackOff that is really a repeating OOMKill. A container that OOMKills on startup, restarts, and OOMKills again lands in CrashLoopBackOff. The crash-loop label hides the memory cause. Always read lastState.terminated.reason. If it says OOMKilled, the fix is memory, not the backoff timing or the readiness probe.
Blaming the limit when the node was the problem. If the reason is Evicted and the node shows MemoryPressure, raising the pod’s limit does nothing, because the pod was not over its limit. The node was overcommitted. Fix it at the packing layer: reduce overcommit by setting honest requests across the workloads on that node, or add capacity. I covered the safe-rollout side of this in ArgoCD sync waves. Getting requests right keeps a GitOps deploy from quietly overpacking a node over successive releases.
A memory leak disguised as a bad limit. If a container’s working set climbs steadily and never levels off, raising the limit only spaces out the same OOMKills. A leak needs fixing, not a bigger cap. The tell is the shape of the curve: a genuine peak-and-return workload plateaus, while a leak trends up forever. I push exactly this into the dashboards described in OpenSearch dashboards for workflow monitoring. “Is this a spike or a leak?” is a question a graph answers in seconds and kubectl describe never will.
A liveness probe restarting an OOM victim into a loop. If a container is being OOMKilled and also has an aggressive liveness probe, you can lose track of which one restarted it. Keep the two concerns separate; I wrote about not overloading health checks in Kubernetes probes. An OOMKill is the kubelet reacting to the kernel, not to a failed probe, and the exit reason tells you which happened.
What I would do differently
Early on, I set memory limits by copying whatever number the last service used. That is how you end up with a fleet of limits unrelated to what anything actually needs. Some were far too tight and OOMKilled under normal peaks. Others were so loose that a leak ran for hours before anyone noticed.
The habit that fixed it was boring:
- Measure each service’s working set under real load before setting the numbers.
- Set the request at the steady state and the limit above the measured peak.
- Promote anything that must not die to Guaranteed QoS by making the request equal the limit.
Requests and limits stopped being magic numbers and became two measurements with two jobs.
The other change was treating a restart with OOMKilled as a first-class alert, not something I noticed while debugging something else. A container that OOMKills is telling you its real memory need has outgrown the box you drew around it. You want to know that on the day it starts, not in the week the restarts get bad enough to page someone.
Where this runs
This is the memory discipline behind the WMCore and Unified operations services. They schedule Monte Carlo production and reconstruction for the CMS experiment across the Worldwide LHC Computing Grid (WLCG). Those services process bursty workloads of varying size, so the gap between steady state and peak is real and worth measuring rather than guessing.
Getting requests and limits right is not glamorous work. But it decides whether a node packs cleanly and degrades gracefully, or instead wastes half its memory on unused reservations or falls over the first time three pods spike at once. The kernel’s OOM killer is not the problem. It is doing exactly what an expectation you never properly set told it to do.
Diagrams by M. Hassan Ahmed, made for this post.
Image credit: Diagrams created by M. Hassan Ahmed for this post, released under CC0 (public domain).