Autoscaling a FastAPI Service with the Kubernetes HPA
The Kubernetes HPA scales pods from a metric, but its defaults thrash and lag under real load. How the control loop works, how to tune it, and where it breaks.

A retrieval backend has a nasty traffic shape. For most of the day it sits nearly idle. Then a shift change lands and forty operators open the copilot at once. The Archi API I worked on for CMS computing operations behaves exactly like this: quiet, quiet, quiet, then a wall of concurrent requests, each one fanning out to an embedding model and a reranker. Provision for the peak, and you pay for idle GPUs all night. Provision for the average, and the first burst queues up behind a handful of overloaded pods.
The Horizontal Pod Autoscaler (HPA) is Kubernetes’ built-in answer. It watches a metric, adds pods when the metric climbs, and removes them when it falls. The mechanism is simple enough that people wire it up in ten minutes and assume they are done. Then it either flaps replicas up and down every minute, or reacts so slowly that the burst is over before the new pods are Ready. Both are tuning problems, and both are avoidable once you know what the loop is actually doing.
This post is for engineers running an HTTP service on Kubernetes who want autoscaling that holds up under real load, not demo load. I walk through the control loop, the scaling formula, where the metrics come from, a working manifest, and the failure modes that cost me the most time.
The HPA is a control loop, not a threshold rule
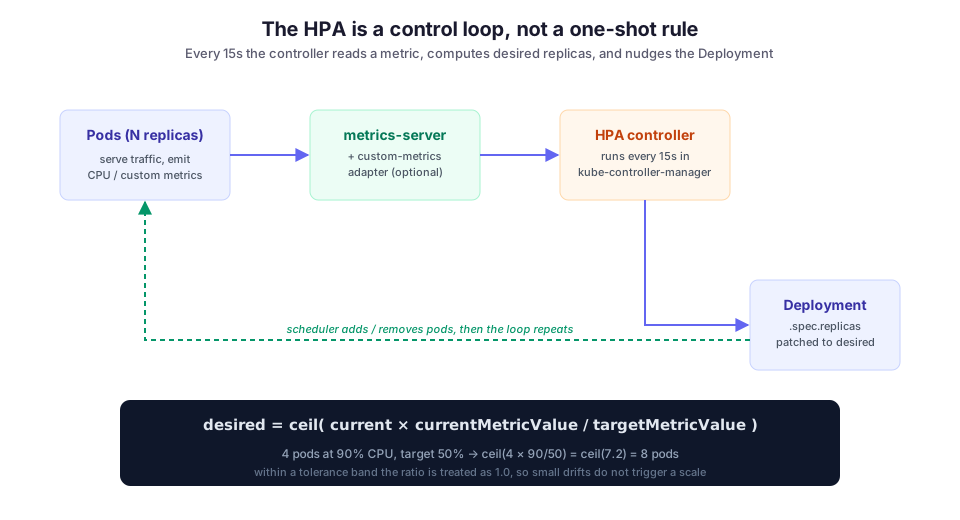
The first mental correction: the HPA is not a rule that fires when a threshold is crossed. It is a feedback loop that runs on a fixed interval and recomputes the whole target on every pass. By default the controller syncs every 15 seconds. The --horizontal-pod-autoscaler-sync-period flag on the kube-controller-manager sets that interval.
Each cycle, the controller does four things:
- Reads the current metric for every pod behind the target.
- Averages those readings.
- Computes how many replicas that average implies.
- Patches the Deployment’s replica count.
Then it waits and does it all again.
The scaling formula
The formula is worth memorizing, because every surprising behavior follows from it:
desiredReplicas = ceil( currentReplicas × (currentMetricValue / targetMetricValue) )Say you run 4 pods averaging 90% CPU, and your target is 50%. The ratio is 1.8, so the HPA wants ceil(4 × 1.8) = 8 pods.
Notice that it scales in proportion to how far off target you are, not by a fixed step. Double the load, and it roughly doubles the replicas in one calculation. That is why the HPA can react to a real spike faster than a naive “add one pod when CPU > 80%” rule ever could.
One guard is built in: a tolerance band. If the ratio lands between 0.9 and 1.1 (the default --horizontal-pod-autoscaler-tolerance of 0.10), the HPA treats it as 1.0 and does nothing. Without that band, floating-point jitter around the target would make it patch replicas on every sync.
Where the metric comes from
The HPA reads metrics through the aggregated Metrics API, and nothing serves that API out of the box. On a bare cluster, your HPA reports <unknown> for the metric and never scales. For CPU and memory, you need metrics-server installed. These two commands install it and confirm it works:
kubectl apply -f https://github.com/kubernetes-sigs/metrics-server/releases/latest/download/components.yaml
kubectl top pods    # if this returns numbers, the HPA can read them
CPU and memory are resource metrics. They cover a lot of ground, but they are only a proxy for load. Consider a service that spends its time waiting on a downstream model rather than burning CPU. For that service, utilization is a bad signal: a pod can be saturated with in-flight requests while sitting at 20% CPU.
At that point, you want a real load signal such as requests per second or queue depth. You expose it through the custom metrics API with an adapter such as the Prometheus Adapter. The loop stays identical; only the source of currentMetricValue changes.
A manifest that works
Here is the autoscaling/v2 HPA I ran for the Archi API. CPU is the coarse signal. The behavior block is where the real tuning lives. Most examples online leave it out and inherit defaults that flap.
apiVersion: autoscaling/v2
kind: HorizontalPodAutoscaler
metadata:
  name: archi-api
spec:
  scaleTargetRef:
    apiVersion: apps/v1
    kind: Deployment
    name: archi-api
  minReplicas: 2
  maxReplicas: 12
  metrics:
    - type: Resource
      resource:
        name: cpu
        target:
          type: Utilization
          averageUtilization: 60
  behavior:
    scaleUp:
      stabilizationWindowSeconds: 0 # react to bursts immediately
      policies:
        - type: Percent
          value: 100 # at most double
          periodSeconds: 30
    scaleDown:
      stabilizationWindowSeconds: 300 # wait 5 min of calm before shrinking
      policies:
        - type: Pods
          value: 1 # remove one pod at a time
          periodSeconds: 60
Grow fast, shrink slowly
Two decisions in this manifest matter more than the metric target.
- Scaling up has a zero-second stabilization window. When a burst hits, you want capacity now.
- Scaling down has a five-minute window. The stabilization window makes the controller use the highest recommendation over that period, not the latest one.
That single asymmetry stops the thrashing. The HPA grows fast and shrinks slowly, so a brief dip between two bursts does not tear down pods you are about to need again.
Why target 60% instead of 80%
averageUtilization: 60 rather than 80 buys headroom. Utilization is averaged across pods and reported with a lag. By the time the average reads 60%, some pods are already hotter, and the new replicas still need time to become Ready. Targeting 60 leaves room for the load that arrives during that gap.
Autoscaling only helps if new pods start fast
The HPA changes a number. Everything after that is latency it cannot control: the scheduler placing the pod, the image pulling, the container starting, the readiness probe passing. That gap is usually where autoscaling quietly fails to help.
If your pods take 90 seconds to become Ready, the 15-second control loop is not your bottleneck; the cold start is. For a service that loads a model or a large index on boot, attack that startup cost first:
- Set a startup probe, so Kubernetes does not kill a slow-booting pod before it is up.
- Keep the image and any warm state small enough that a new replica is useful in seconds, not minutes.
An HPA in front of a two-minute cold start reacts on time and still misses the burst.
Right-sized requests matter here too. The HPA computes CPU utilization as usage divided by the pod’s CPU request. If the request is wrong, the percentage is meaningless. A request that is too low pins you near 100% forever; one that is too high hides real load. This is the same request-versus-limit distinction that decides whether a pod gets OOMKilled, and the HPA depends on you getting it right.
Failure modes I have actually hit
The HPA and the Deployment fight over replicas. Suppose your Deployment manifest hard-codes replicas: 3, and something re-applies it (a GitOps sync, or a kubectl apply from CI). The two will tug the count back and forth. The fix is to stop managing replicas on the Deployment once an HPA owns it. Either drop the field from the manifest, or tell your GitOps tool to ignore it; ArgoCD has ignoreDifferences for exactly this.
Metrics briefly unavailable, and the HPA freezes. When metrics-server restarts, or a pod has no metrics yet, the reading goes <unknown>. The HPA is deliberately conservative here and will not scale on missing data. So a metrics outage during a spike means no scaling at all. Treat metrics-server as a production dependency with its own alert, not a fire-and-forget add-on.
Blocking the event loop, so CPU never rises. This one is specific to async services. If a request handler does CPU-bound or synchronous work on the event loop, throughput collapses while CPU still looks moderate, and the HPA sees no reason to scale. The queue grows, latency climbs, and replicas stay flat. I wrote about the underlying trap in blocking the FastAPI event loop. The autoscaling lesson is that the HPA can only react to a metric that actually moves, and a pod that is saturated but idle produces no such metric.
Scaling on a lagging average during a sharp spike. CPU utilization is smoothed and delayed. If traffic goes from near zero to peak in seconds, the pods are already drowning by the time the average crosses your target. When latency is what you care about, scale on a leading signal instead, such as requests per second or in-flight request count, through the custom metrics path.
Tradeoffs, and what I would reach for next
The HPA is the right default. It is built in, needs nothing beyond metrics-server, and its algorithm is simple enough to reason about at 2am. Its ceiling is that it scales on utilization-style metrics and never goes below one replica. It cannot scale to zero, and it is awkward for work driven by a queue rather than by CPU.
When the workload is event-driven, such as a batch of jobs landing on a queue (like the bursty operations work that fills a lot of my week), KEDA is the better fit. KEDA scales on external signals such as Kafka lag, queue length, or a Prometheus query. It can scale to zero when the queue is empty and start the first pod again when work arrives. Under the hood it still creates an HPA, so everything above about stabilization windows and readiness latency carries straight over.
For the Archi API the plain HPA on CPU, tuned to grow fast and shrink slow, handles the shift-change burst well enough that I haven’t needed the custom-metrics path yet. The moment CPU stops tracking real load, which it will the day more of the latency moves into an external model call, requests per second through the custom metrics API is the next step. Autoscaling that survives contact with production is mostly this: pick a metric that actually reflects load, make new pods cheap to start, and tune the loop to grow faster than it shrinks.