Tracing a RAG Pipeline with OpenTelemetry
Trace a RAG pipeline with OpenTelemetry: instrument FastAPI, put each retrieval and model step in its own span, and read the latency waterfall in OpenSearch.

One afternoon a RAG answer came back slow on Archi, the retrieval copilot I worked on for CMS computing operations at CERN. It was not broken, just slow enough that an operator would notice and lose trust in it. The logs told me the request took about 2.3 seconds and returned the right answer. They did not tell me which part took the 2.3 seconds. Was it the embedding call, the vector search, the reranker, or the model? I had five suspects and one number.
You cannot optimize what you cannot see, and a log line that says request completed in 2312ms sees almost nothing. This post is for engineers running an LLM pipeline behind FastAPI who want to know where the time actually goes, per request, without guessing.
I will instrument a RAG endpoint with OpenTelemetry, the open standard for collecting traces and other telemetry. Along the way I explain spans and context propagation without hand-waving, ship the traces to OpenSearch, and cover the parts that bite once you turn this on in production.
What spans and traces are
The core idea is small. A span is one timed operation with a name, a start, an end, and some attributes (key-value details you attach). A trace is a tree of spans that share an id, so vector_search and llm_generate both know they belong to the same POST /chat. That parent-child link is the whole point. It lets you draw the request as a waterfall and see at a glance what was waiting on what. The OpenTelemetry traces spec defines these terms precisely, but this mental model is enough to start.
Here is the request that started the investigation, drawn the way tracing draws it once the spans exist.
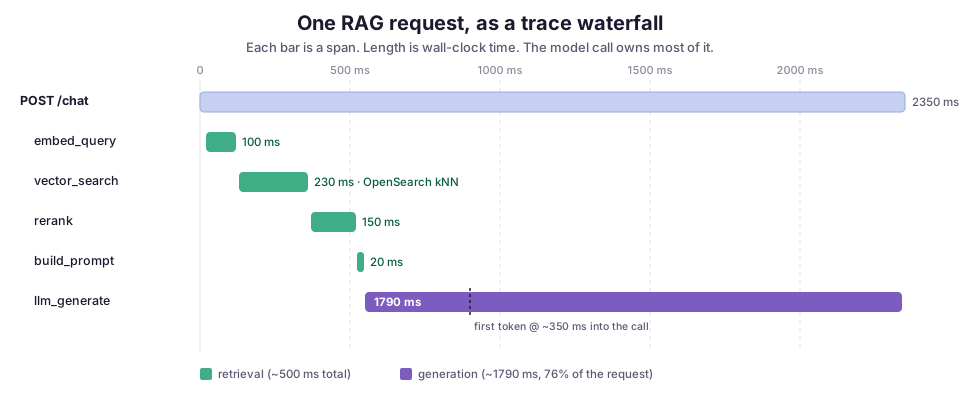
The picture answers the question the log could not. All of retrieval together is about half a second. The model call is 1.79 seconds, three-quarters of the request. An afternoon spent tuning chunk sizes would have shaved tens of milliseconds off the wrong thing. The lever was the generation step: a smaller model for simple questions, or streaming the answer so the operator sees the first token at 350 ms instead of staring at a spinner until 2.3 seconds. One trace redirected the whole effort.
Instrumenting a FastAPI endpoint
Two layers do the work:
- The instrumentation library wraps FastAPI, so every HTTP request gets a root span (the top of the tree) for free.
- You add manual spans inside your handler for the steps that matter to you, because OpenTelemetry has no idea what “rerank” is.
First, install the SDK, the OTLP exporter, and the FastAPI instrumentation:
pip install opentelemetry-sdk \
            opentelemetry-exporter-otlp \
            opentelemetry-instrumentation-fastapi
Then wire up a tracer provider once at startup. This code names the service and sends finished spans over OTLP (the OpenTelemetry wire protocol) to a collector:
from opentelemetry import trace
from opentelemetry.sdk.resources import Resource
from opentelemetry.sdk.trace import TracerProvider
from opentelemetry.sdk.trace.export import BatchSpanProcessor
from opentelemetry.exporter.otlp.proto.grpc.trace_exporter import OTLPSpanExporter

resource = Resource.create({"service.name": "archi-api"})
provider = TracerProvider(resource=resource)
provider.add_span_processor(
    BatchSpanProcessor(OTLPSpanExporter(endpoint="http://otel-collector:4317"))
)
trace.set_tracer_provider(provider)
BatchSpanProcessor matters more than it looks. It buffers finished spans and flushes them on a background thread, so exporting never sits in the request path. Use the simple processor in a tutorial and you add a network write to every span. Use it in production and you have coupled your request latency to your observability backend being up. Batch, always.
Now attach FastAPI and add spans where the interesting work happens. Each with block below times one pipeline step, and the set_attribute calls record details such as how many hits came back and how many the reranker kept:
from fastapi import FastAPI
from opentelemetry.instrumentation.fastapi import FastAPIInstrumentor

app = FastAPI()
FastAPIInstrumentor.instrument_app(app)     # root span per request
tracer = trace.get_tracer("archi.rag")

@app.post("/chat")
async def chat(q: Query):
    with tracer.start_as_current_span("embed_query"):
        vector = embed(q.text)

    with tracer.start_as_current_span("vector_search") as span:
        hits = await opensearch_knn(vector, k=20)
        span.set_attribute("retrieval.k", 20)
        span.set_attribute("retrieval.hits", len(hits))

    with tracer.start_as_current_span("rerank") as span:
        top = rerank(q.text, hits)[:5]
        span.set_attribute("rerank.kept", len(top))

    with tracer.start_as_current_span("llm_generate") as span:
        span.set_attribute("gen_ai.request.model", "claude-sonnet")
        answer = await generate(q.text, top)
        span.set_attribute("gen_ai.usage.output_tokens", answer.tokens)

    return {"answer": answer.text}
start_as_current_span does the quiet, essential thing: it makes each span a child of whatever span is currently active. FastAPIInstrumentor has already opened a root span for the request, so embed_query and the rest hang off it automatically, and you never pass a parent id around by hand. That is context propagation. Inside one process the SDK handles it through a context variable, so it survives await boundaries correctly.
The attributes are the other half. A span with only a name gives you a duration. A span with retrieval.hits, rerank.kept, and gen_ai.usage.output_tokens lets you ask why a request was slow, not just that it was. When you name model attributes, follow the OpenTelemetry GenAI semantic conventions, the standard attribute names for model calls, so your fields line up with tooling later. They are still marked experimental, so pin the version you use and expect the names to move.
Propagating context across services
The trace above lives in one process. Real pipelines cross service boundaries, and that is where naive instrumentation quietly breaks. Your gateway makes a span and calls the RAG service, the RAG service makes its own root span, and now you have two disconnected traces for one user action instead of one.
The fix is a standard. On the way out, OpenTelemetry serializes the active span’s id into an HTTP header, and on the way in it reads the header back. The header follows the W3C Trace Context traceparent format. If both services are instrumented and both speak OTLP, this is automatic for ordinary HTTP calls.
It slips wherever the auto-instrumentation does not reach: a task pushed onto a queue, a message dropped on Kafka, a job handed to a background worker. Nobody copies the header for you there, so you inject it on the producer side and extract it on the consumer side yourself:
from opentelemetry.propagate import inject, extract

# producer: stamp the current context onto the message
headers = {}
inject(headers)
queue.publish(payload, headers=headers)

# consumer: restore it so the worker's spans join the same trace
ctx = extract(incoming.headers)
with tracer.start_as_current_span("process_job", context=ctx):
    ...
Miss this on one hop and the trace splits exactly there. It is the first thing I check when a waterfall looks suspiciously short, because a truncated trace usually means a boundary where the context was dropped.
Getting traces into OpenSearch
The app should not talk to storage directly. It ships spans to an OpenTelemetry Collector, a separate process that receives spans, batches them, optionally samples them, and forwards them. That indirection is worth it: the Collector lets you change backends, add sampling, or drop noisy spans without redeploying the application.
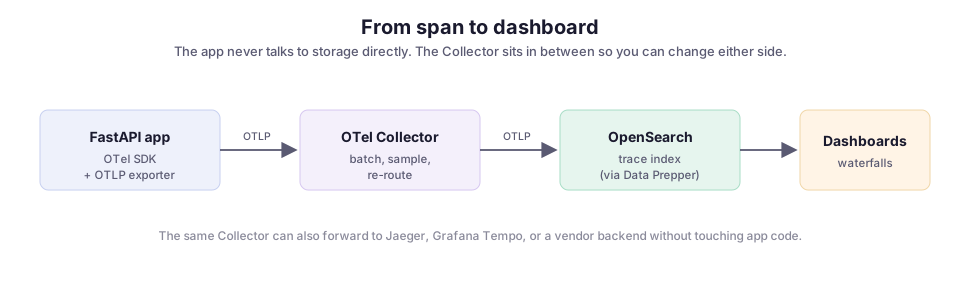
On the OpenSearch side, Data Prepper receives OTLP traces and writes them into indices that its trace views understand. We already run OpenSearch for workflow monitoring on the CMS workflow stack. If you do too, this keeps traces next to the logs and metrics you already look at, on infrastructure your team runs. The Collector’s output is just OTLP, so the same setup points at Jaeger or a hosted backend by editing one config file instead of touching the app.
Where tracing breaks in production
The happy path is short. The failures are where the engineering is.
Tracing everything is a bill and a haystack. Every span is data you produce, ship, and store, so tracing every request on a busy service drowns the signal and makes you pay for the privilege. The answer is sampling, and the choice that matters is when you decide. Head sampling decides at the root, before the request runs, so it is cheap but blind: it throws away the slow, broken requests you most wanted to see. Tail sampling decides in the Collector after the request finishes, so it can keep every error and every request over a latency threshold and sample the boring successful ones. Tail sampling costs more to run and is worth it, because catching the outliers is the whole reason you turned tracing on.
Attributes are an exfiltration risk. It is tempting to attach the user’s prompt and the model’s full answer to the span. Don’t, at least not without thinking. Spans flow to a backend that more people can read than can read your database, and a raw prompt can carry names, access tokens, or internal data. Record the token count, the model name, and the retrieval scores; keep the free text out, or redact it before it ever reaches a span attribute.
Sync work on the event loop hides in a clean-looking trace. A span faithfully times its block, so a slow synchronous embedding call inside an async handler shows up as an honest 300 ms span. What the waterfall will not tell you is that the call also blocked the event loop and stalled every other request for those 300 ms. Tracing measures the operation, not the contention it causes, so read the trace with that failure mode in mind.
Manual spans rot. Refactor the handler, move the rerank into a helper, forget to move the with block, and the waterfall silently loses a step. Instrumentation is code, and it drifts from reality like any other code. When a trace looks too simple, suspect the instrumentation before you trust the picture.
What I would do differently
I used manual with blocks in the examples because they show the mechanism plainly, and that is the right way to learn it. In a real service I would push most of it behind a decorator, so each function gets a span named after itself and I stop hand-editing with blocks on every refactor. The tradeoff is real: a decorator hides the span boundaries, and the one time you need to set an attribute mid-function, you are back to the explicit form. So I keep the decorator for the common case and drop to a manual span exactly where I need to record something specific, like the retrieval k or the output token count.
The larger lesson from Archi is that observability is not a dashboard you add at the end. It is the difference between “the copilot feels slow” and “generation is 76 percent of p95 latency, here is the request, here is the span.” The first is a complaint; the second is a work item. Tracing is how you turn one into the other. It is the same instinct behind the OpenSearch monitoring work: make the system’s internal state something you can see on a screen, before someone downstream has to ask.
Diagrams by M. Hassan Ahmed, released under CC0. No external image was used for this post; the figures are original work by the author.