OpenSearch Dashboards for Workflow Monitoring
Build an OpenSearch dashboard that watches a job pipeline: structured logs, an index mapping, the queries behind each panel, and alerts that fire early.

A workflow pipeline fails quietly. Jobs move through states, get scheduled across a fleet of sites, retry, and mostly finish. Then one dataset stops progressing, and nobody notices until someone downstream asks where their output is. By then the failure is hours old. The useful context (which job, which site, which exit code) is buried in a log file on a machine you have to go find.
This post is for engineers running any kind of batch or workflow system, such as a job scheduler, an ETL pipeline, or a CI fleet. If you want to see that system’s state on a screen instead of grepping logs after the fact, this covers the setup: structured events, a mapping, the queries behind each panel, alerts, and retention.
I ran the workflow management stack (WMCore + Unified) for the CMS experiment at CERN. There, Monte Carlo production and reconstruction jobs run across the Worldwide LHC Computing Grid. Part of that work is the OpenSearch and Grafana monitoring that gives operators visibility before a dataset delay turns into a problem. The pattern below is the reusable core of it, with the CMS-specific parts stripped out.
I will use OpenSearch, the Apache-2.0 fork of Elasticsearch and Kibana. Everything here maps almost one to one onto Elasticsearch if that is what you run.
Start with structured events, not prose logs
Most pipelines already log. The problem is that they log prose:
2026-07-01 09:14:02 job 88213 for mc-reco-2026 failed on T2_CH_CERN after 812s, exit 8021A human reads that fine. A dashboard cannot. To count failures per site, you have to parse the sentence back into fields with a fragile regex, and that regex breaks the day someone reorders the message. The fix is to emit the fields directly and let the sentence go. Here is the same event as a JSON document:
{
  "@timestamp": "2026-07-01T09:14:02Z",
  "workflow": "mc-reco-2026",
  "state": "failed",
  "site": "T2_CH_CERN",
  "attempt": 3,
  "duration_s": 812,
  "exit_code": 8021
}
Same information, but now state and site are queryable dimensions, and duration_s is a number you can average. Every panel and every alert later in this post is just a question asked against these fields. Structure the event once, at the source, and everything downstream gets cheap.
The diagram below shows the whole path. The pipeline emits one JSON document per state change, a shipper pushes it into OpenSearch, and OpenSearch Dashboards asks aggregate questions of the index.
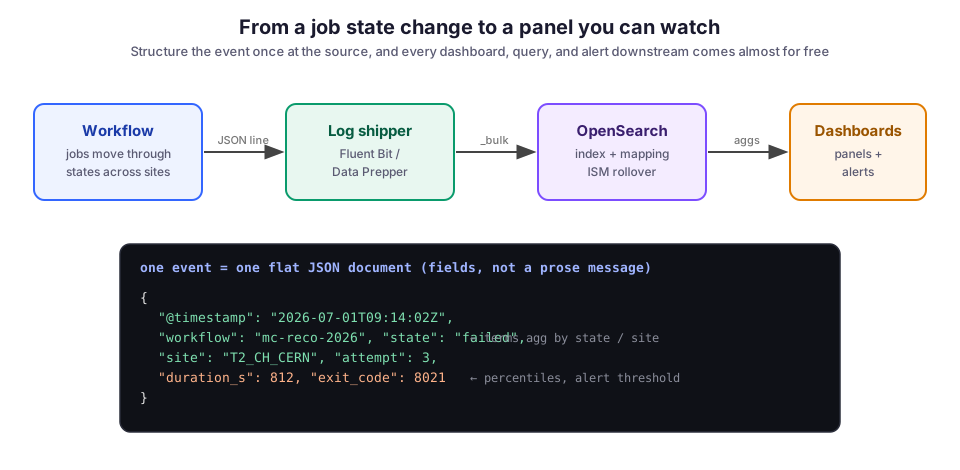
If you get to choose field names, borrow them from the Elastic Common Schema. Naming things event.duration and host.name instead of inventing your own means integrations, and future-you, already know what the fields mean.
Define the mapping before the data arrives
The mapping is the index’s schema: the type of each field. OpenSearch will happily index a document it has never seen and guess the types. That guessing, called dynamic mapping, is the trap. Guess wrong once, and the field is stuck with the wrong type until you reindex. The classic failure is an id like exit_code that arrives as a number in one document and a string in another. OpenSearch rejects the second one, and you lose events without an obvious error on the dashboard.
Set the types yourself with an index template, so every new workflow-events-* index inherits them:
PUT _index_template/workflow-events
{
  "index_patterns": ["workflow-events-*"],
  "template": {
    "mappings": {
      "properties": {
        "@timestamp": { "type": "date" },
        "workflow":   { "type": "keyword" },
        "state":      { "type": "keyword" },
        "site":       { "type": "keyword" },
        "attempt":    { "type": "integer" },
        "duration_s": { "type": "long" },
        "exit_code":  { "type": "keyword" }
      }
    }
  }
}
The important choice here is keyword versus text:
- A
textfield is analyzed, meaning it is broken into tokens for full-text search. It cannot be grouped on without extra work. - A
keywordfield is stored whole, and it is what you aggregate on.
Anything you want to count, filter, or group by (states, sites, workflow names) is a keyword. I mapped exit_code as a keyword on purpose, even though it looks numeric. I never do arithmetic on it; I only group by it. Treating codes as categories avoids the type-collision problem entirely.
Getting events into the index
You have two sane options for moving documents into the index.
A log shipper. The shipper tails your structured output and forwards it. Fluent Bit is the light one and has a native OpenSearch output. Data Prepper is the OpenSearch-native option if you want to parse and enrich events in flight. On Kubernetes the shipper runs as a DaemonSet (one copy on every node), and you barely think about it. This is the right default, because your application code stays out of the indexing path entirely: it writes JSON to stdout, and the shipper does the rest.
The Bulk API, directly. A small service writes to the Bulk API itself. That is worth it when you want to control batching and backpressure (holding producers back when the cluster falls behind) yourself. The snippet below uses the Python client’s bulk helper to send events in batches:
from opensearchpy import OpenSearch, helpers

client = OpenSearch("https://opensearch:9200", http_auth=(user, pw), verify_certs=True)

def index_events(events):
    actions = ({"_index": "workflow-events-write", **e} for e in events)
    helpers.bulk(client, actions, chunk_size=500, request_timeout=30)
Batch it. One HTTP request per event will melt the cluster under any real load. The bulk helper groups events, and 500 to a few thousand documents per request is the usual sweet spot. Write to an alias like workflow-events-write rather than a dated index name, so the rollover described later is invisible to the writer.
Each panel is one aggregation query
Once the fields are in, each dashboard panel is one aggregation query: a query that returns counts or statistics over many documents instead of the documents themselves. Build the panels in the Dashboards UI, but know the query underneath, so you understand what each panel costs and can reproduce it outside the UI.
Jobs per state. How many jobs are in each state right now is a terms aggregation, which counts documents per distinct value of a field:
GET workflow-events-*/_search
{
  "size": 0,
  "query": { "range": { "@timestamp": { "gte": "now-1h" } } },
  "aggs": {
    "by_state": { "terms": { "field": "state", "size": 20 } }
  }
}
size: 0 means return no raw documents, only the aggregated counts. That is all a panel needs, and it keeps the response small. Nest a second terms on site inside by_state and you get a breakdown of failures per site in the same request.
Throughput. Whether the pipeline is keeping up is a date_histogram: throughput bucketed over time. It becomes the line chart everyone stares at. This one counts completed jobs per five-minute bucket:
"aggs": {
  "over_time": {
    "date_histogram": { "field": "@timestamp", "fixed_interval": "5m" },
    "aggs": { "completed": { "filter": { "term": { "state": "completed" } } } }
  }
}
Duration. How long jobs are taking is a percentiles aggregation on duration_s. Watch the p95 and p99 (the 95th and 99th percentiles), not the average. The mean hides the tail, and the tail is where the stuck jobs live. An average duration that looks healthy while p99 quietly climbs is the early signal that something is starting to back up.
Filtering. To filter across the whole dashboard, use the Dashboards Query Language bar at the top. state: failed and site: T2_CH_CERN narrows every panel at once. That is how you go from “something is wrong” to “it is this site” in a couple of keystrokes.
Alerting: the point of the whole exercise
A dashboard only helps when someone is looking at it. At 3 a.m., nobody is. The alerting plugin closes that gap: it runs a saved query on a schedule and fires when a condition holds.
A monitor is the query plus a trigger. The query finds jobs stuck in a non-terminal state for longer than they should be (here, running for 3600 seconds or more, checked every five minutes). The trigger says how many is too many:
{
  "name": "stuck-jobs",
  "schedule": { "period": { "interval": 5, "unit": "MINUTES" } },
  "inputs": [{
    "search": {
      "indices": ["workflow-events-*"],
      "query": {
        "size": 0,
        "query": { "bool": { "must": [
          { "term":  { "state": "running" } },
          { "range": { "duration_s": { "gte": 3600 } } }
        ]}},
        "aggs": { "stuck": { "cardinality": { "field": "workflow" } } }
      }
    }
  }]
}
The trigger condition is a small Painless script (OpenSearch’s built-in scripting language) evaluated against the result: ctx.results[0].aggregations.stuck.value > 5. The action is a notification channel, such as Slack, email, or a webhook into your on-call tool. Set the threshold above your normal noise floor. An alert that fires every day is one people mute, and a muted alert is the same as no alert.
Retention, or the disk fills up
Workflow events never stop arriving, and an index that only grows will eventually take the cluster down with it. Index State Management (ISM) is the answer. An ISM policy rolls the write index over to a fresh one once it hits a size or age, and deletes old indices past your retention window. The policy below rolls over at 30GB or one day, and deletes indices once they are 30 days old:
{
  "policy": {
    "states": [
      { "name": "hot",
        "actions": [{ "rollover": { "min_size": "30gb", "min_index_age": "1d" } }],
        "transitions": [{ "state_name": "delete", "conditions": { "min_index_age": "30d" } }] },
      { "name": "delete", "actions": [{ "delete": {} }] }
    ]
  }
}
This is why the writer targets an alias instead of a fixed index name. ISM swaps the underlying index on rollover. The write alias always points at the current index, so nothing upstream has to know the swap happened.
Failure modes I have actually hit
Timezones on @timestamp. These bite first. Log a naive local time (one with no timezone offset) and OpenSearch assumes UTC. Your panels are then silently shifted by hours, and the 3 a.m. spike shows up at what looks like the wrong time. Always emit ISO-8601 with an explicit offset, ideally UTC, at the source.
Dynamic fields from free-form objects. Suppose part of your event is a free-form object, such as per-job metadata with arbitrary keys. Dynamic mapping creates a new field for every distinct key it sees. Thousands of one-off fields bloat the cluster state (the cluster-wide metadata that includes every mapping) and slow everything down. Set "dynamic": "strict" on the objects you control, or store the loose part as a single stringified blob you do not aggregate on.
High-cardinality group-bys. People learn this one the hard way. A terms aggregation on individual job_id values asks OpenSearch to build a bucket per job, which is fine at a hundred and painful at ten million. Aggregate on the low-cardinality dimensions (those with few distinct values), like state and site. Reach for the raw documents only once you have narrowed down to a handful.
Tradeoffs, and where Grafana fits
OpenSearch Dashboards and Grafana overlap, and I run both. Here is the split I settled on:
- OpenSearch owns the event data: the discrete “job X changed to state Y” records you want to search, filter, and drill into.
- Grafana is stronger for time-series metrics from a system like Prometheus: continuous numbers such as queue depth and CPU.
Reaching for the wrong one is a common early mistake. Full-text-searchable events want a search engine; regularly sampled numeric series want a time-series database. Forcing high-frequency metrics into per-sample OpenSearch documents works right up until the document count buries you.
The honest cost of this whole setup is that OpenSearch is a stateful cluster you now operate. It needs memory, disk, and enough attention that ISM and shard sizing do not surprise you. For a small pipeline that is real overhead, and a few structured log files plus jq might be all you need. The pattern earns its keep once you have enough jobs, sites, or states that no single person can hold the state of the system in their head.
What I would do differently
I would define the mapping template on day one instead of letting the first documents create it dynamically. Early on I let OpenSearch infer types. Weeks later a field arrived in a shape the guess did not cover, I hit a type collision, and I had to reindex to fix it. Writing the template first is ten minutes that saves that afternoon.
I would also wire up the stuck-jobs alert before building a single pretty panel. It is tempting to spend the first day making charts, but charts only help when someone is watching them, and the alert covers the hours when nobody is. The dashboard is for investigating a problem you already know about; the alert is what tells you there is one.
For fuller context, the CMS Workflow Operations writeup covers the WMCore and Unified stack this monitoring sits on top of. Archi is the retrieval copilot I built for the same operations team. It uses the same structured operational data from the other direction, searching it instead of charting it.
Image credit: workflow-monitoring diagrams by M. Hassan Ahmed, created for this post, released under CC0 (public domain).