Tracing an LLM Agent with OpenTelemetry
An LLM agent request hides where the time and tokens went behind one flat log. Trace it with OpenTelemetry spans, the GenAI conventions, and where it breaks.

A single agent request is not a single thing. It plans, retrieves, calls a tool, maybe retries that tool, calls the model again to write the answer, and streams the answer back. From the outside it is one HTTP request that took 3.2 seconds. From the inside it is five or six steps. When the whole thing feels slow, or a bill arrives bigger than you expected, the log line POST /chat 200 3187ms tells you nothing about which step is to blame.
This post is for engineers running an LLM agent or a RAG backend in production who have hit that wall: the request is slow or expensive, and print statements are not cutting it. I will build up a trace of one agent run with OpenTelemetry, the open standard for emitting telemetry such as traces. Then I attach the GenAI attributes that make LLM spans actually useful, and spend the back half on where tracing quietly lies to you.
The running example is Archi, the RAG copilot I worked on for CMS computing operations at CERN. There, a single operator question fans out into retrieval, a couple of model calls, and a tool lookup against a ticket system. “Why did that take four seconds” is a real question I have had to answer.
Spans, traces, and context propagation
Three terms carry the whole idea, so it is worth being precise:
- A span is one named, timed unit of work. It has a name (
llm.generate), a start and end timestamp, and a bag of key-value attributes. - A trace is a tree of spans that share one
trace_id. That is howretrieve,llm.plan, andllm.generateall belong to the same request and know their parent. - Context propagation is the mechanism that carries the current
trace_idand parentspan_idfrom one function, thread, or service to the next. It is how a span created deep in your tool code knows it belongs underagent.runinstead of starting a new orphan trace. Across services, the wire format for that hand-off is the W3C Trace Contexttraceparentheader.
That is the entire model. Logs tell you what happened at a point in time. A trace tells you how those points relate and how long each took. For a linear script the difference is cosmetic. For an agent, where the interesting question is which of several steps ate the latency, it is the difference between guessing and knowing.
Here is one Archi request drawn as its span tree, which is how any trace UI (Jaeger, Grafana Tempo, OpenSearch) will show it to you:
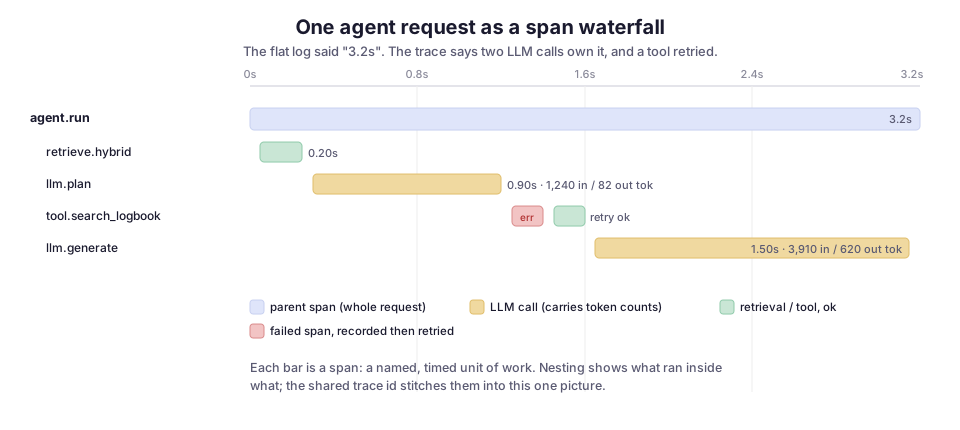
The shape does the explaining. Retrieval is cheap. The two model calls own the wall-clock time, so any latency work should start there, not with the vector search you assumed was slow. The tool span is also red on its first attempt: it failed, got recorded, and was retried. A success-only log hides exactly that kind of thing.
Instrumenting the agent by hand
Start with manual spans, because auto-instrumentation makes more sense once you have felt what a span is. The Python SDK gives you a tracer, and start_as_current_span opens a span and makes it the parent of anything created inside the block. The code below wraps the whole request in an agent.run span and the retrieval step in a child span that records how many chunks it asked for and got back:
from opentelemetry import trace

tracer = trace.get_tracer("archi.agent")

def handle_question(question: str) -> str:
    with tracer.start_as_current_span("agent.run") as root:
        root.set_attribute("input.question_len", len(question))

        with tracer.start_as_current_span("retrieve.hybrid") as span:
            chunks = retriever.search(question, k=8)
            span.set_attribute("retrieve.k", 8)
            span.set_attribute("retrieve.hits", len(chunks))

        plan = call_llm("plan", question, chunks)      # its own span, below
        answer = call_llm("generate", question, chunks, plan)
        return answer
Because retrieve.hybrid opens inside the agent.run block, context propagation makes it a child automatically. You thread no IDs through arguments; the SDK keeps a per-context stack. That is the payoff of built-in propagation. It is also the thing that breaks the moment you carelessly cross a thread or an await boundary, which is the first failure mode below.
The LLM call is where the useful attributes live. It is also where you should stop inventing your own attribute names and adopt the standard ones.
Name LLM attributes with the GenAI semantic conventions
OpenTelemetry has a set of semantic conventions for GenAI: an agreed vocabulary for naming these attributes, so every backend, dashboard, and vendor reads them the same way. Using them means a tokens-per-request panel you build today keeps working when you swap model providers tomorrow. These are the load-bearing few, straight from the attribute registry:
gen_ai.operation.name:chat,generate_content,embeddingsgen_ai.request.modelandgen_ai.response.model: what you asked for and what answeredgen_ai.usage.input_tokensandgen_ai.usage.output_tokens: the numbers your cost is a function ofgen_ai.response.finish_reasons:stop,length,tool_calls; a spike inlengthmeans you are truncating answersgen_ai.provider.name: which vendor’s flavor this span speaks
Set them on the LLM span and the token columns in the waterfall above come for free. The helper below opens one span per model call, named after the operation, and records the model, the token usage, and why the model stopped:
def call_llm(op, question, chunks, plan=None):
    with tracer.start_as_current_span(f"llm.{op}") as span:
        span.set_attribute("gen_ai.operation.name", "chat")
        span.set_attribute("gen_ai.request.model", "claude-sonnet-4-5")
        resp = client.messages.create(...)
        span.set_attribute("gen_ai.usage.input_tokens", resp.usage.input_tokens)
        span.set_attribute("gen_ai.usage.output_tokens", resp.usage.output_tokens)
        span.set_attribute(
            "gen_ai.response.finish_reasons", [resp.stop_reason]
        )
        return resp.content
You rarely have to write all of this yourself. OpenLLMetry from Traceloop is a set of OpenTelemetry instrumentations that wrap the common provider SDKs, vector stores, and agent frameworks, and emit these exact spans and attributes automatically. It outputs standard OTLP (the OpenTelemetry wire protocol), so it is not a competing format; it is the conventions applied for you. Writing a couple of spans by hand first still pays off: when the auto-instrumented version produces a span you do not understand, you will know what it is.
Where the spans go: exporter, collector, backend
Your app should not know or care what stores the traces. It emits spans over OTLP to a collector, a separate process that receives telemetry and forwards it, and the collector fans them out to a backend. That indirection is the point. You can swap Jaeger for Tempo for OpenSearch without touching agent code, and you do the cross-cutting work (sampling, batching, stripping sensitive fields) in one place.
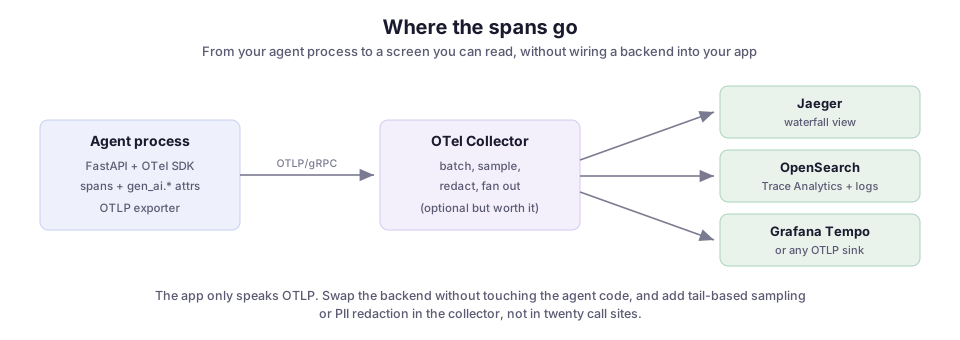
I reach for OpenSearch here because it is already where the operational logs live for the workflow tooling I run. Its Trace Analytics puts traces next to those logs under one query language, the same stack behind the dashboards I wrote about for workflow monitoring. If you have no such constraint, Jaeger is the shortest path to a waterfall on screen. The choice does not change your instrumentation, which is the whole argument for putting the collector in the middle.
Where tracing quietly lies
The happy path took ten minutes. The rest decides whether you can trust the traces.
Broken context propagation splits your trace. When work jumps to a thread pool, a background task, or an un-awaited coroutine, the context does not follow automatically, and the child span starts a brand-new trace with no parent. You end up with agent.run in one trace and the LLM call it made in another, which is worse than no trace because the waterfall looks complete and is not. When you offload a blocking call to a thread (the exact fix from the FastAPI event-loop post), capture the context before the hop and re-attach it inside. This is the single most common reason a trace “looks wrong.”
Capturing prompts and completions is opt-in for real reasons. The conventions let you record full message content, and in development that is gold. In production it means user questions and model answers land in your tracing backend, which is now a system holding potentially sensitive text, subject to whatever data rules that text carries. Content capture also bloats every span, and some backends silently truncate large attributes, so you get half a prompt and no warning. Default to metadata (token counts, model, finish reason), turn on content capture deliberately, and redact in the collector, not at the call site.
Sampling drops the trace you wanted. Under load you cannot keep every trace, so you sample. Head-based sampling decides at the root, before it knows whether the request will fail or run slow, so it throws away errors and successes at the same rate. The fix is tail-based sampling in the collector: buffer the spans, keep the trace if it errored or crossed a latency threshold, and downsample the boring ones. That costs memory in the collector and is worth it, because the traces you actually open are the slow and failed ones, exactly the ones head sampling discards.
Streaming makes “when did the span end” ambiguous. For a streamed response, do you end the LLM span at the first token or the last? They answer different questions: the first token is the latency the user feels, and the last token gives the cost and total duration. Record both, with time-to-first-token as an attribute or event on the span and the span duration covering the full generation. Ending the span at first token undercounts every generation length you have; ending it silently at last token hides the responsiveness number people actually complain about.
Token attributes are only as honest as what you set. A span claiming output_tokens: 0 usually means the SDK could not read usage (common on streaming or on an error path), not that the model emitted nothing. Traces make numbers look authoritative. Validate the numbers you build alerts on against a provider bill or a known request before you trust a dashboard built on them.
Tradeoffs, and what I would do differently
Tracing is not free. Every span costs CPU, memory, and network, and a poorly bounded content-capture policy can put more bytes into your observability pipeline than into your actual responses. For a small side project, structured logs with a request id and the token counts get you eighty percent of the value with a fraction of the moving parts. Tracing earns its cost once a request touches several steps and you can no longer hold the causality in your head. For an agent, that is basically request one.
If I were wiring this up on a new service from scratch, I would do two things in a different order than I did the first time:
- Put the collector in from day one, even pointed at a local Jaeger, so that switching or adding a backend is a config change and never a code change.
- Adopt the
gen_ai.*convention names before writing a single custom attribute. Renaming attributes after you have built dashboards and alerts on them is the kind of tedious migration that never quite gets finished.
For Archi the concrete win was unglamorous, and that is exactly the point. An operator asked why an answer took four seconds. I opened the trace, and the waterfall showed the second model call doing almost all of it, while retrieval, the part everyone suspected, sat at two hundred milliseconds. That is what tracing buys: not a prettier dashboard, but an end to arguing about which step is slow when the trace already knows. It is the same instinct behind the OpenSearch monitoring I built for the workflow fleet: structure the event once, at the source, and every question you ask later becomes cheap to answer.
Diagrams by M. Hassan Ahmed, released under CC0. No external image was used for this post; the figures are original work by the author.