Scale Kubernetes Workers on Queue Depth with KEDA
A CPU-based HPA can't see a backed-up queue, so workers fall behind. How KEDA autoscales Kubernetes workers on queue depth, and where it breaks.

A worker that pulls jobs off a queue is the most common shape of backend code I run on Kubernetes. For a long time it was also the thing I autoscaled worst. The default tool is the HorizontalPodAutoscaler (HPA), which adds or removes pods based on a metric, and out of the box that metric is CPU. That works for a request-serving API, where more traffic means more CPU. It falls apart for a queue worker, because the whole point of a queue is that work can pile up before anyone does anything with it.
Picture a worker that fetches a URL, waits on the response, and writes a row. It spends most of its wall-clock time waiting on the network. So a single pod might sit at 30% CPU while a thousand messages stack up behind it. The HPA sees 30%, decides everything is calm, and adds no pods. The backlog grows, latency climbs, and the signal you are scaling on never moves. You were measuring the wrong thing.
This post is for people running queue-driven workers on Kubernetes who have watched a backlog build while the HPA sat still. It covers:
- why CPU is the wrong signal;
- what KEDA actually does under the hood;
- a
ScaledObjectyou can copy, and the arithmetic behind it; - how scale-to-zero works;
- the failure modes that cost real time.
My running example is the CMS workflow operations stack I maintained at CERN. There, Monte Carlo production and reconstruction requests are queued and processed across grid sites, and “how many workers should be running right now” has a moving answer.
Queue depth measures the work; CPU only approximates it
The HPA scales on a metric because it assumes the metric tracks the work. For a CPU-bound service, that holds. For an I/O-bound worker, it does not, and the backlog hides in the gap between the proxy (CPU) and the real thing (waiting work).
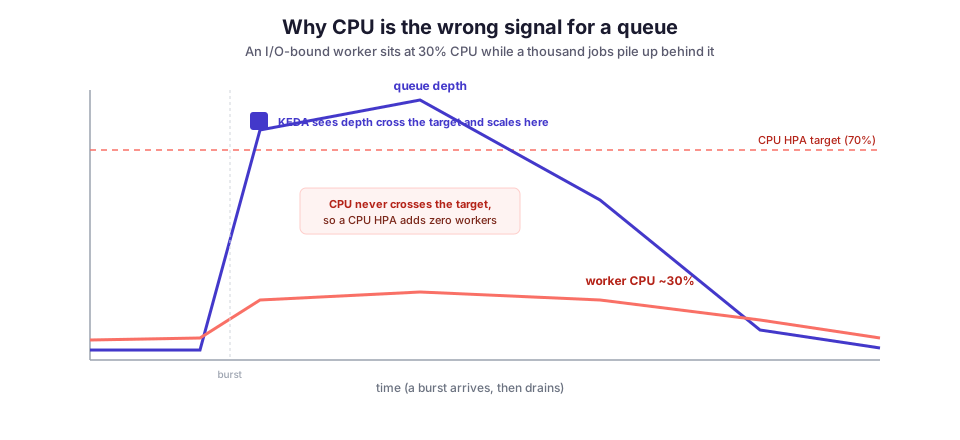
The number that actually describes the work sits in the message broker: how many messages are waiting. Scale on that, and the feedback loop closes. More messages bring more pods, the pods drain the queue, the count falls, and the pods go away again.
You could wire this up yourself with the HPA’s external metrics API and a custom metrics adapter. But you would be writing and running a metrics server for each source. KEDA is that adapter, already written for a long list of sources.
What KEDA does: it feeds the HPA instead of replacing it
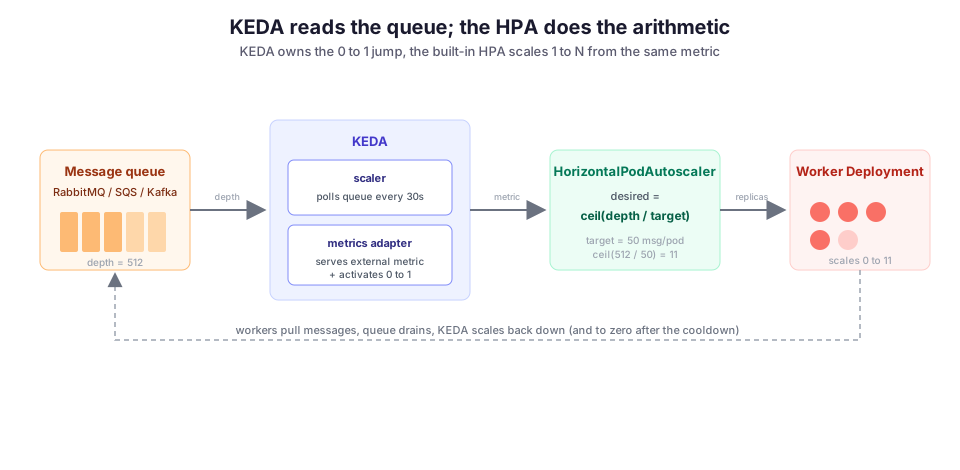
KEDA (Kubernetes Event-Driven Autoscaling) is a CNCF project that graduated in 2023. It does not replace the HPA; it feeds it. What made it click for me is that KEDA and the HPA split the job:
- KEDA owns the 0-to-1 transition. A plain HPA cannot scale a Deployment to zero, and it cannot bring one back from zero, because with no pods there are no pod metrics to read. KEDA watches the event source directly. So it can start the first pod when work appears and remove the last one when the queue is empty.
- The HPA owns 1-to-N. Once at least one pod is running, KEDA’s metrics adapter serves the queue depth as an external metric, and a normal HPA does the scaling math on it. KEDA generates that HPA object for you from your config.
So you write one custom resource, a ScaledObject, and KEDA turns it into a metrics adapter plus a managed HPA.
A ScaledObject for a queue worker
Here is a ScaledObject for a worker that reads a RabbitMQ queue. It targets the existing Deployment by name and points a trigger at the broker:
apiVersion: keda.sh/v1alpha1
kind: ScaledObject
metadata:
  name: reco-worker
spec:
  scaleTargetRef:
    name: reco-worker          # the Deployment to scale
  minReplicaCount: 0            # allow scale to zero when idle
  maxReplicaCount: 40           # ceiling, so a bad producer can't melt the cluster
  pollingInterval: 20           # seconds between queue checks (default 30)
  cooldownPeriod: 300           # wait 5 min of no activity before going to zero
  triggers:
    - type: rabbitmq
      metadata:
        protocol: auto
        queueName: reconstruction
        mode: QueueLength
        value: "50"             # target messages per pod
        activationValue: "5"    # need >5 waiting before starting the first pod
      authenticationRef:
        name: rabbitmq-conn
Four numbers control the behavior, and each maps to a decision you actually care about:
value: "50"is the target backlog per pod. It is not a maximum concurrency; it is the queue depth per pod that the HPA aims to hold. A lower value means more pods for the same queue.activationValue: "5"gates the jump from zero. Below six waiting messages, the worker stays at zero and costs nothing. It is deliberately separate fromvalue, for reasons I come back to below.maxReplicaCount: 40limits the blast radius. When you autoscale on an external number, a misbehaving producer can ask for unbounded pods, so this ceiling is not optional.cooldownPeriod: 300is how long the queue must stay quiet before KEDA removes the last pod. It applies only to the final step down to zero.
The replica math is the standard HPA formula
KEDA picks the replica count with no magic. It is the standard HPA algorithm, with queue depth as the metric:
desiredReplicas = ceil(currentQueueDepth / value)With value: "50" and 512 messages waiting, that is ceil(512 / 50) = 11 pods. Drain the queue to 90, and the HPA settles toward ceil(90 / 50) = 2.
The target is a ratio, not a rate, and that trips people up. It does not say “50 messages per second per pod.” It says “keep roughly 50 messages of backlog behind each pod.” If your jobs are slow, 50 messages of backlog might be minutes of work. So tune value against how long one message takes, not against an abstract throughput number.
Because the HPA does the 1-to-N math, its scale-down stabilization window still applies (five minutes by default). The window smooths out flapping between, say, 4 and 5 pods. The cooldownPeriod is a different setting that only governs the very last step to zero. If you confuse the two, you will tune the wrong knob when scale-down feels sluggish.
Scale to zero, and why activation is a separate number
Scale-to-zero is the feature people come for. The activationValue is the part they skip and then get burned by.
value decides how many pods you run once you are running. activationValue decides whether you run at all. They are separate because the HPA math breaks down at zero: with zero replicas, there is no current metric to divide. So KEDA has to make the 0-to-1 decision itself, based on a threshold you set.
Suppose you set only value: "50" and leave activation at its default of 0. Then a single stray message wakes the whole Deployment. For a worker whose image takes 40 seconds to pull and warm up, bouncing between 0 and 1 on one-off messages is worse than running one pod all the time. Set activationValue above the noise floor, so you only cold-start when there is real work.
The other half of the tradeoff is the cold start itself. Coming back from zero costs a scheduling delay, an image pull, and whatever your app does before it reads the first message. If tail latency matters more than the cost of an idle pod, do not scale to zero. Set minReplicaCount: 1 and keep one pod warm.
Where it breaks
Most of the sharp edges are not in KEDA itself. They come from the fact that your pod count now depends on a number a producer controls.
Long jobs versus a shrinking queue. Queue depth counts messages that are waiting. With most brokers, a message being processed has already left the ready count. If each job takes ten minutes, the depth can read low while every pod is busy, so the HPA tries to scale down mid-job. Three things help:
- For RabbitMQ, count unacknowledged plus ready messages rather than ready alone.
- Keep
terminationGracePeriodSecondslong enough for a pod to finish its in-flight work. - Rely on the stabilization window, so a brief dip does not evict a busy worker.
Poison messages scale you to the ceiling. A poison message is one that always fails, gets requeued, and fails again, which keeps the depth high forever. KEDA does the only thing it can and adds pods. You sit pinned at maxReplicaCount, paying for work that will never succeed. Queue-depth autoscaling assumes messages eventually leave the queue. Pair it with a dead-letter queue and a retry cap, so failures exit instead of recirculating.
Polling is not instant. KEDA checks the source every pollingInterval seconds (30 by default), so a burst that arrives and clears within one interval may never be seen. A tighter interval helps, but it adds load on the broker’s management API, which for RabbitMQ is not free. For genuinely spiky traffic, a shorter interval plus a small minReplicaCount beats polling every two seconds.
The bottleneck moves downstream. Autoscaling the workers is easy. The shared database they all write to is not elastic. Scale from 2 workers to 40, and you may have just pointed 40 concurrent writers at a connection pool sized for 5. I have traced a “scaling problem” that was really Postgres refusing connections. Cap maxReplicaCount at what the slowest downstream dependency can absorb, not at what the queue wants.
Non-idempotent work punishes scale events. Every scale-down can kill a pod mid-message. If your handler is not idempotent (safe to run twice on the same message), a redelivered message writes twice. This is a property of your consumer, not of KEDA. But autoscaling makes pod churn routine, so it exposes bugs that a fixed replica count hid. Make the handler idempotent before you make the fleet elastic.
What I would set up first
If I were adding this to a queue worker today, I would go in this order:
- Make the worker idempotent and have it dead-letter poison messages. Then add the
ScaledObject. - Start with
minReplicaCount: 1, and skip scale-to-zero until I have watched the metric behave for a week. A cold start hiding behind a p99 latency spike is annoying to diagnose after the fact. - Set
maxReplicaCountfrom the downstream limit, not from the queue. - Pick
valueby timing one message, not by guessing a throughput number.
Queue-depth scaling fits the CMS workflow tooling because the work there is bursty and genuinely queued. Production and reconstruction requests arrive in waves. The useful signal is always the backlog, never the CPU of a worker that spends its life waiting on grid I/O.
The same reasoning is behind treating requests and limits as a reliability setting rather than a formality, and behind ordering a rollout with ArgoCD sync waves. On Kubernetes, the defaults are a reasonable starting point and a poor finish line. Measure the thing that describes the work, then scale on it.
Diagrams by the author, released under CC0. No external image was used for the thumbnail.