Graph MST Plotting
Cache Size Over Miss Rate Study.

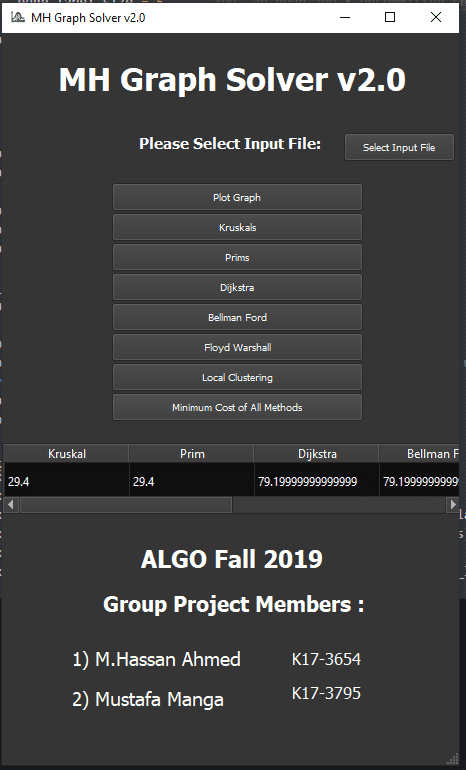
PyQt5, A Python GUI Library, was used to design the User Interface for our ‘MH Graph Solver’. It takes the provided netsim input files, parses them and plots them using Networkx and Matplotlib.
We first Parse the given netsim files and insert into our networkx graph model that will help us manage the Graph Data Structure.
The graph object is then utilized by different functions to calculate Minimum Cost based on required Algorithms. We can display output of all above mentioned Algorithms. We can also Display Total Minimum Cost of all Methods in a simple table.
In case of Local Clustering Co-efficient, We color coded the vertex color in terms of the Local Clustering Co-effecient.
Higher the Local Clustering Co-efficient of vertex, Darker the color of the respective vertex. A list of Local Clustering Co-efficient for all vertices is also generated.